B2B Saas CAC Payback Period Benchmarks 2026
B2B SaaS CAC Payback Period Benchmarks 2026: The Short Answer
Short answer: no defensible universal median can be stated without a disclosed cohort. The most useful B2B SaaS CAC payback period benchmarks for 2026 are stage-specific and transparently sourced.
| Cohort | Payback | Sample | Published | Data period | Definition | Type |
|---|---|---|---|---|---|---|
| Overall | Not available from a disclosed cohort | |||||
| Early stage | Not available from a disclosed cohort | |||||
| Growth stage | Not available from a disclosed cohort | |||||
| Later stage | Not available from a disclosed cohort | |||||
| Public SaaS | Not available from a disclosed cohort | |||||
Here, 2026 describes the planning view, not necessarily the source collection year. Lower payback returns acquisition cash sooner, but an appropriate threshold depends on retention, gross margin, growth, capital availability, and customer segment. Explore B2B revenue benchmarks and the benchmark methodology for sourcing and labeling details.
Calculate CAC Payback on a Consistent Gross-Margin Basis
Use a gross-margin-adjusted CAC payback formula when comparing performance with B2B SaaS CAC payback period benchmarks 2026:
- CAC payback months = fully loaded CAC ÷ monthly gross profit from the acquired customer.
- CAC payback months = CAC ÷ (annual recurring revenue per new customer × gross margin) × 12.
Fully loaded CAC equals acquisition-period sales and marketing costs attributable to new customers, divided by the number of new customers acquired. Apply the same cost-allocation rules across periods. Also confirm whether the benchmark uses new-logo revenue only or includes expansion, then calculate your result on that same basis.
Hypothetical example, not benchmark data: Assume $18,000 CAC, $12,000 in annual recurring revenue, and 80% gross margin. Annual gross profit is $9,600, so monthly gross profit is $800. The calculation is $18,000 ÷ $800 = 22.5 months.

A revenue-only calculation would divide CAC by monthly revenue without adjusting for delivery costs. That produces a shorter, better-looking result, but it is not comparable with gross-margin-adjusted SaaS CAC benchmarks. RevXForge provides free revenue calculators for consistent, no-signup analysis.
Where CAC Payback Changes Most
Blended SaaS CAC benchmarks can conceal major differences in acquisition cost, contract value, gross margin, sales-cycle length, and retention. The segmented evidence below preserves each source’s cohort definitions rather than forcing incompatible findings into a single taxonomy. See the broader B2B revenue research for supporting context.
Read each segmentation as a separate analytical lens:
- Company stage reflects maturity, funding, operating priorities, and available capital.
- GTM motion distinguishes approaches such as product-led, sales-led, inbound, outbound, and partner acquisition.
- Customer segment separates cohorts by buyer size or market position.
These lenses can overlap. Before comparing B2B SaaS CAC payback period benchmarks 2026, confirm that the formula basis, measurement period, gross-margin treatment, and customer definitions match.
The same payback figure can also imply different levels of risk. For a bootstrapped company with limited cash, it may constrain hiring and growth. A well-capitalized company with strong net revenue retention may accept that period because expansion revenue improves the longer-term economics. Treat the benchmark as context, not an automatic spending target.
By Company Stage and Capital Profile
CAC payback by company stage is meaningful only when each study’s original cohort definition is retained.
| Cohort | Median or range | Sample |
|---|---|---|
Early-company CAC can be volatile because small acquisition cohorts and founder-led selling distort fully loaded costs. Scaling companies may report longer payback while hiring sales capacity or entering new segments, but that is not automatically healthy. Funding stage alone does not determine an acceptable payback period.
By Go-to-Market Motion
CAC payback by GTM motion is directional, not a ranking. Self-service can lower selling costs, although smaller contracts limit monthly gross profit. Enterprise sales can carry higher CAC and longer cycles, offset by larger contracts and potentially stronger retention.
| Motion | Source-backed evidence |
|---|---|
| Self-service PLG | |
| Sales-assisted PLG | |
| Sales-led enterprise | |
| Partner-led | |
| Hybrid |
Apply each source’s CAC treatment consistently, including partner commissions, onboarding, and sales assistance.
By Customer Segment
CAC payback by customer segment is most comparable when cohorts use explicit annual contract value or account-revenue bands, not broad labels. Enterprise acquisition usually requires more sales labor and longer cycles, but higher contract value can offset those costs. SMB payback may look faster while high churn still produces weak economics.
| Cohort | Evidence required |
|---|---|
| Lowest contract-value band | |
| Lower-middle band | |
| Middle band | |
| Upper-middle band | |
| Highest contract-value band |
Confirm whether each cohort covers new logos, all customers, or a blended base before comparing results. See the benchmark methodology for disclosure conventions.
Interpret the Gap Before Cutting Acquisition Spend
Treat variance from B2B SaaS CAC payback period benchmarks 2026 as a diagnostic signal, not a pass or fail grade. Decompose the gap into acquisition cost, contract value, gross margin, and time to revenue.
Then examine lead quality, win rate, sales-cycle duration, rep ramp, pricing, onboarding, churn, and expansion before blaming marketing spend. For example, if CAC per opportunity remains stable but longer sales cycles increase payback, the likely constraint is conversion efficiency or segment fit, not an immediate need to cut budget.
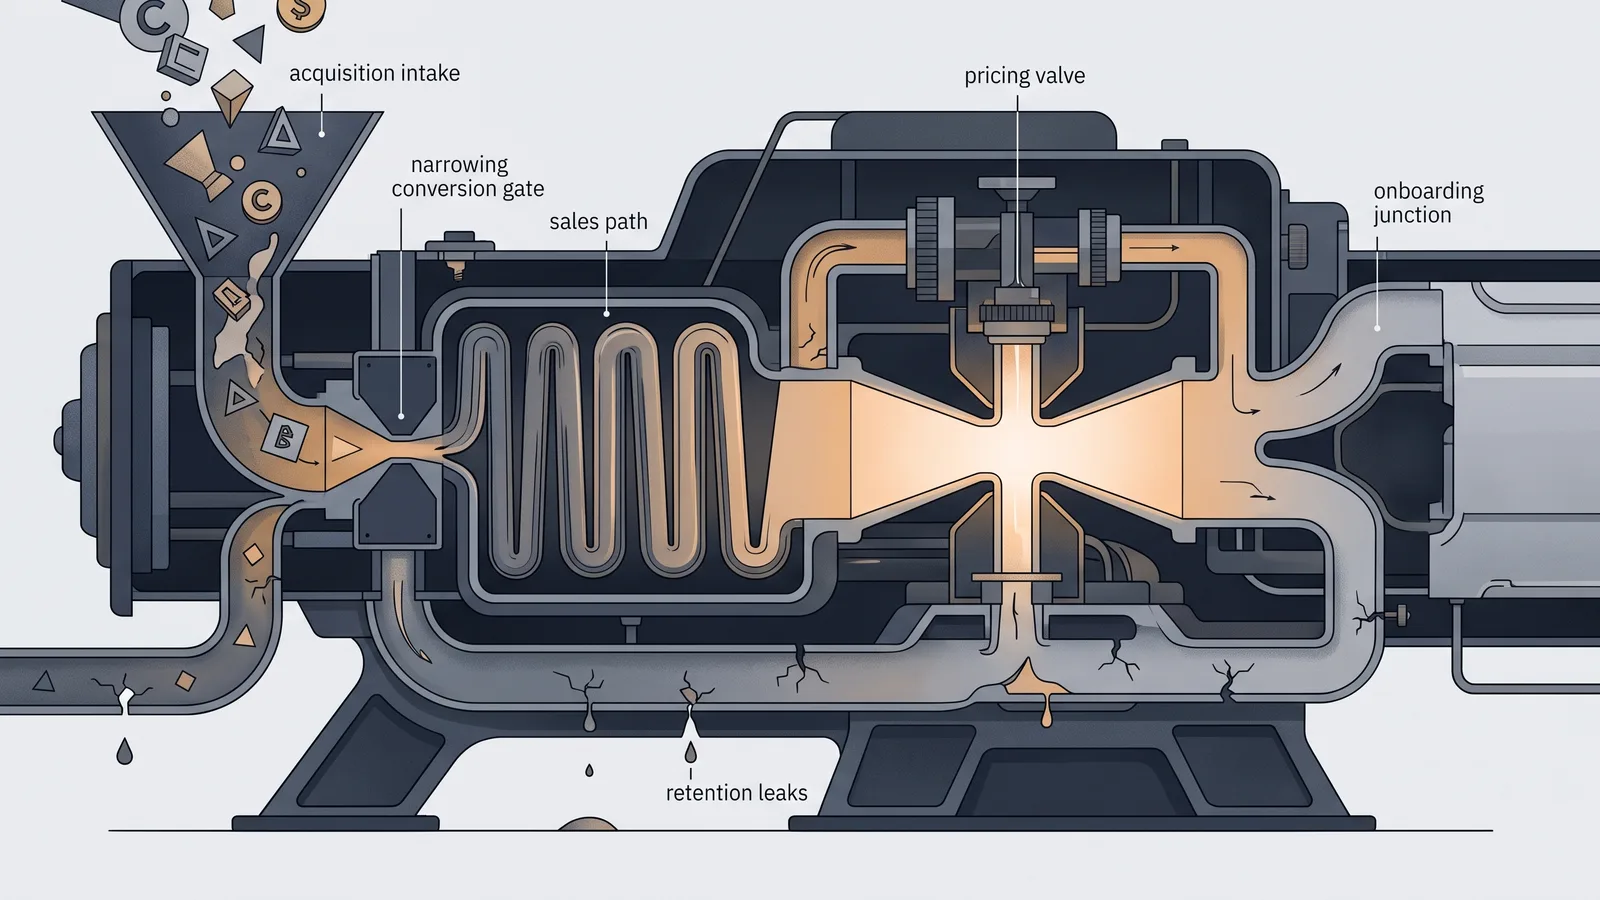
Track trends by channel and customer segment because a blended figure can conceal opposing movements. A shorter payback is not automatically better if it reflects underinvestment in durable growth or excludes legitimate acquisition costs. Use the Revenue Engine Diagnostic to determine whether the underlying constraint sits in pipeline, conversion, capacity, or economics.
Set a 2026 Operating Threshold, Not a Universal Target
Turn the benchmark into an operating threshold:
- Normalize the CAC payback formula, including gross margin and acquisition-cost allocation.
- Select the closest credible cohort, then reconcile retention, contract value, and billing terms.
- Investigate the components behind any material variance.
Set a target, warning threshold, and review cadence. Track trailing and cohort-based payback, then assess both alongside net revenue retention, gross margin, growth, burn, and available cash before increasing spend.
See RevXForge’s research labeling standards for treatment of third-party, measured, and derived findings. The free RevXForge research library gives B2B founders and revenue leaders a broader evidence base.
Frequently Asked Questions
What is a good CAC payback period for B2B SaaS?
A good CAC payback period for B2B SaaS is generally, but no single target fits every business. Earlier-stage, lower-margin, capital-constrained, SMB, or self-serve companies usually need faster payback, while well-funded enterprise and sales-led businesses may support longer periods when gross margins and retention are strong.
Should expansion revenue count toward CAC payback?
Expansion revenue can count toward CAC payback in a cohort model if it is attributed to the acquired customers and measured consistently, but standard new-logo payback usually includes only revenue or gross profit from newly acquired customers. Do not compare an expansion-inclusive result with a new-logo-only benchmark unless you adjust for the different methodology.
How often should a SaaS company review CAC payback?
Review CAC payback monthly if acquisition volume is high enough to produce reliable cohorts, or quarterly if volume is lower. Track rolling trends and customer cohorts rather than a single-period result, and use longer observation windows when small samples create volatility.
Conclusion
B2B SaaS CAC payback period benchmarks in 2026 are most useful as segmented reference points, not universal targets, so compare your result with peers that share your customer segment, deal size, stage, and go-to-market motion. RevXForge provides free, no-signup CAC payback tools and a Revenue Engine Diagnostic to help establish a consistent figure and identify whether pipeline, conversion, capacity, or economics is driving the gap.
Calculate Your CAC Payback, Then Diagnose the Constraint
Use RevXForge's free, no-signup calculation tools to establish a consistent payback figure. If the result misses your selected benchmark, use the Revenue Engine Diagnostic to examine pipeline, conversion, capacity, and economics before changing spend.
Learn more